
K-Nearest Neighbor (K-NN)
k-Nearest Neighbor (k-NN) is one of those algorithms that are very simple to understand but works incredibly well in practice. Also it is surprisingly versatile and its applications range from vision to proteins to computational geometry to graphs and so on.
Introduction to K-NN
k-nearest neighbor algorithm (k-NN) is a non-parametric method used for classification and regression. In both cases, the input consists of the k closest training examples in the feature space. The output depends on whether k-NN is used for classification or regression. k-NN is a type of instance-based learning, or lazy learning, where the function is only approximated locally and all computation is deferred until classification. The k-NN algorithm is among the simplest of all machine learning algorithms. The k-NN algorithm is an implementation method for inferring the class of things based on the Euclidean distance.
Let’s understand k-NN in mathematical way:
Consider we have data sets with classes.
| Data set | Class | Data set | Class | Data set | Class |
|---|---|---|---|---|---|
| X1 = (0.8, 0.8) | 1 | X2 = (1.0, 1.0) | 1 | X3 = (1.2, 0.8) | 1 |
| X4 = (0.8, 1.2) | 1 | X5 = (1.2, 1.2) | 1 | X6 = (4.0, 3.0) | 2 |
| X7 = (3.8, 2.8) | 2 | X8 = (4.2, 2.8) | 2 | X9 = (3.8, 3.2) | 2 |
| X10 = (4.2, 3.2) | 2 | X11 = (4.4, 2.8) | 2 | X12 = (4.4, 3.2) | 2 |
| X13 = (3.2, 0.4) | 3 | X14 = (3.2, 0.7) | 3 | X15 = (3.8, 0.5) | 3 |
| X16 = (3.5, 1.0) | 3 | X17 = (4.0, 1.0) | 3 | X18 = (4.0, 0.7) | 3 |
There are three classes and they are 1, 2, 3. We consider test pattern P = (3.0, 2.0) and k = 5.
Now calculate the distance between X and P using Euclidean Distance. Here X represents all the data sets from data sheets X1, X2, X3…. X18. P represents the test pattern and k = 5 stands for 5 nearest neighbors.
In several ways we can write the formula of Euclidean Distance.
Euclidean Distance,
.
Or
Euclidean Distance
, here XH stands for Observed value and HI stands for Actual value.
Or
Euclidean Distance
.
So, I prefer the third one because it’s easy to understand and looking good. Now, if I write the third formula using data sets and test patterns, it will be looking like this.
Euclidean Distance = 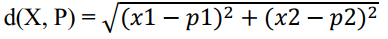
I wish after using the data sets X and test pattern P, someone will not actually understand what’s going on in the formula. Then let’s try with the values of X and P. Here, for the value of X, I use the values of X1(0.8, 0.8) from the data sheet and for the value of P (test pattern), use P(3.0, 2.0).
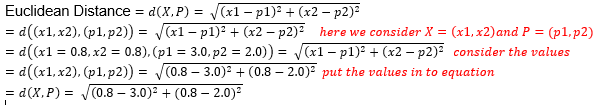
I wish it’s now understandable for everyone. Now, dig into the mathematics and let’s see test pattern P(3.0, 2.0) belongs to which class. In this example, we have only three classes and they are 1, 2, and 3.
Let’s find the distance between X and P and find the five lowest results because k = 5
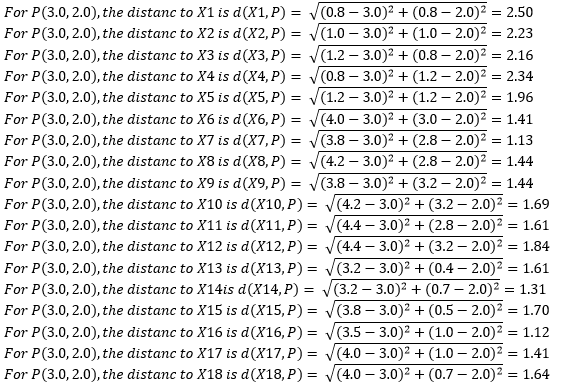
Here the list of five lowest results with their class after calculating the distance between X and P. As we consider k = 5 then the nearest neighbor are given below in the list.
| 1st lowest | Class | 2nd lowest | Class | 3rd lowest | Class | 4th lowest | Class | 5th lowest | Class |
|---|---|---|---|---|---|---|---|---|---|
| X16 = 1.12 | 3 | X7 = 1.13 | 2 | X14 = 1.31 | 3 | X6 = 1.41 | 2 | X17 = 1.41 | 3 |
Now we consider that, Class 1 = 0, Class 2 = 2 (X6, X7), Class 3 = 3 (X14, X16, X17). That means class 3 has the highest nembers. So, with k = 5, test pattern P(3.0, 2.0) belongs to Class 3. Let’s see the k-NN algorithm and Implement in Matlab
k in the k-NN algorithm refers to finding the number of training set elements closest to the test sample or test pattern.
First, the k-NN algorithm is described as follows:
- Initialize the training set and category.
- Calculate the Euclidean distance between the test set sample and the training set sample.
- Sorting the training set samples in ascending order according to the Euclidean distance.
- Select the top K training samples with the smallest Euclidean distance and count their frequencies in each category.
- The category with the highest return frequency, that is, the test set sample belongs to this category.
Second, Matlab code implementation After understanding the algorithm steps, the algorithm can be easily implemented. As an excellent tool for researching data, Matlab is a good choice for implementing and understanding this algorithm.
The Matlab code:
%% Implementation of KNN algorithm
%% Algorithm description
%1, initialization training set and category;
%2, calculate the Euclidean distance between test set sample and training set sample;
%3, the training set samples are sorted in ascending order according to the Euclidean distance size;
%4, selecting the first k training samples with the lowest Euclidean distance, and counting their frequencies in each category;
%5, the most frequently returned category, that is, the test set sample belongs to that category.
close all;
clc;
%% algorithm implementation
% step1, initialize training set, test set, K value
% Create a 3D matrix, 2D representing 2D coordinate points under the same class, 3D representation category
trainData1=[0 0;0.1 0.3;0.2 0.1;0.2 0.2];% first training data
trainData2=[1 0;1.1 0.3;1.2 0.1;1.2 0.2];% second training data
trainData3=[0 1;0.1 1.3;0.2 1.1;0.2 1.2];% of the third type of training data
trainData(:,:,1)=trainData1;%Set the first type of test data
trainData(:,:,2)=trainData2;% sets the second type of test data
trainData(:,:,3)=trainData3;%Set the third type of test data
trainDim=size(trainData);% gets the dimension of the training set
testData=[1.6 0.3];% sets 1 test point
K=7;
%% calculates the Euclidean distance between each point in the test set and the point in each training set
% expand test points into matrices
testData_rep=repmat(testData,4,1);
%Set three two-dimensional matrix to store the difference squared between the test set and the extended matrix of the test point
%diff1=zero(trainDim(1),trianDim(2));
%diff2=zero(trainDim(1),trianDim(2));
%diff3=zero(trainDim(1),trianDim(2));
for i=1:trainDim(3)
diff1=(trainData(:,:,1)-testData_rep).^2;
diff2=(trainData(:,:,2)-testData_rep).^2;
diff3=(trainData(:,:,3)-testData_rep).^2;
end
%Set three one-dimensional arrays to store Euclidean distance
distance1=(diff1(:,1)+diff1(:,2)).^0.5;
distance2=(diff2(:,1)+diff2(:,2)).^0.5;
distance3=(diff3(:,1)+diff3(:,2)).^0.5;
% combines three one-dimensional arrays into a two-dimensional matrix
temp=[distance1 distance2 distance3];
% converts this two-dimensional matrix into a one-dimensional array
distance=reshape(temp,1,3*4);
% sorts the distance
distance_sort=sort(distance);
% uses a loop to find the smallest K distances in the class that has the highest frequency and returns this class
num1=0; % of the number of occurrences of the first class
num2=0; % of the number of occurrences of the second class
num3=0; % of the third class occurrences
sum=0; % sum1, sum2, sum3
for i=1:K
for j=1:4
if distance1(j)==distance_sort(i)
num1=num1+1;
end
if distance2(j)==distance_sort(i)
num2=num2+1;
end
if distance3(j)==distance_sort(i)
num3=num3+1;
end
end
sum=num1+num2+num3;
if sum>=K
break;
end
end
class=[num1 num2 num3];
classname=find(class(1,:)==max(class));
fprintf('test point (%f %f) belongs to class %d', testData(1), testData(2), classname);
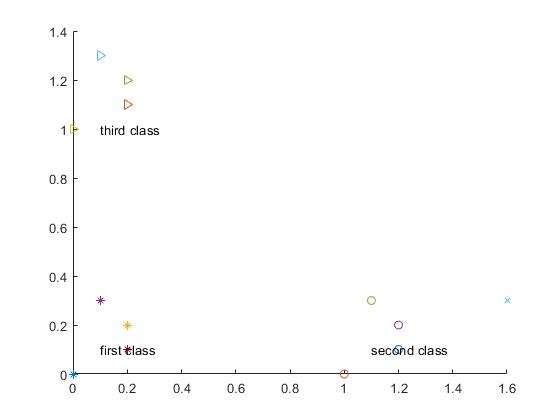
%% draws training set points and test sets using drawingfigure(1);
hold on;
for i=1:4
plot(trainData1(i,1),trainData1(i,2),'*');
plot(trainData2(i,1),trainData2(i,2),'o');
plot(trainData3(i,1),trainData3(i,2),'>');
end
plot(testData(1),testData(2),'x');
text(0.1,0.1, 'first class');
text(1.1,0.1, 'second class');
text(0.1,1, 'third class');
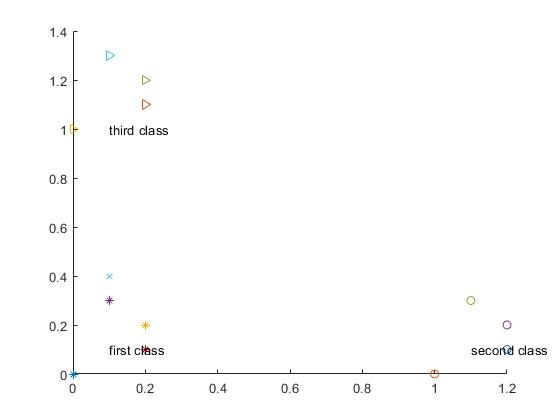
Third, the test results For the test point testData=[1.6 0.3], the test results are as follows: In the figure, the star represents the first type of training sample points, the circle represents the second type of training sample points, the triangle represents the third type of training sample points, and x represents the test sample points.
The test point (1.600000 0.300000) belongs to the category or class 2.
Change the test point to: testData=[0.1 0.4], and the results are as follows:
Test point (0.100000 0.400000) belongs to category 1
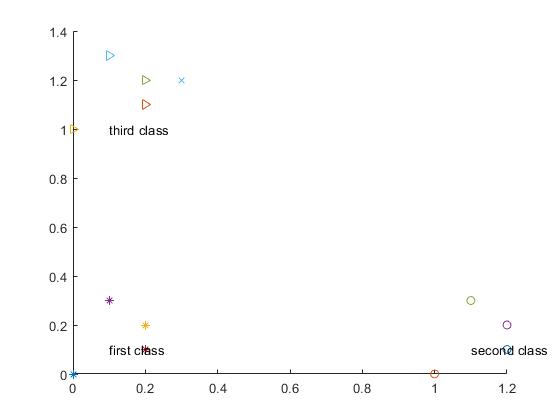
Change the test point to: testData=[0.3 1.2], the test results are as follows:
The test point (0.300000 1.200000) belongs to category or class 3
After testing, it can be seen that k-NN can achieve the sample classification function very well, and the understanding is simple and easy. For the developers of the beginner classifier, k-NN is a good choice!